Table of contents
Table of contents- How Can You Reduce The Impact of the Bullwhip Effect?
- Bullwhip Effect Current Situation
- Bullwhip Effect’s Impact on Supply Chain:
- Testing Tactics to minimize the impact of the Bullwhip Effect:
- What to do to Minimise Bullwhip Effect’s Impact?
- Dealing with Demand Drops:
- Bullwhip effect takeaways
- Bullwhip Effect FAQs
Bullwhip Effect Current Situation
Many companies are currently dealing with a strong bullwhip effect. In part, this problem is tied to the ongoing impacts of the pandemic, but it’s amplified by the changing nature of demand for consumer goods.
Consider that during the pandemic many companies were over-buying to meet rising consumer demand, but due to container and harbor shortages, a lot of these products were backed up.
These shortages caused companies to order even more as they reasoned this would give them a larger share of the pie. As lead times return to normal, however, all these products are finally flowing in but demand drops for these same products leading to large excess inventory.
At a time when central banks are also increasing interest rates, the bullwhip effect becomes a high priority for many executives. Three years into the pandemic, the bullwhip effect continues to cause problems for companies.
So what can businesses do to mitigate the sting of this supply whip?
First, we’ll explore the impact of this effect, then examine proven tactics to minimize the bullwhip effect. Finally, we’ll talk about how to stop the bullwhip even before it starts by identifying the origins of demand drop.
Bullwhip Effect’s Impact on Supply Chain:

The above Figure 1 shows the typical COVID demand (they are real numbers) that we noticed across our customers from Sep 21 until May 22, and a sudden drop in demand starting June 22. When demand drops for many items at once, the impact is huge but how does it affect the supply chain at scale?
To understand this further, in 2020 Slimstock played two simulation games with participants from the supply chain industry:
- To see the actual impact of the bullwhip effect
- To test a few effective tactics to mitigate the impact
In the first game, we simulated a supply chain of hand sanitizer facing a sudden bump in demand and let the participants take on a role in the supply chain (one person played as a retailer, wholesaler, distributor, or manufacturer).
The game was played with traditional supply chain practices over 20 rounds (equal to 20 weeks). When we say “traditional”, we meant:
- a supply chain with no communication between the different roles, other than the order they place with each other.
- On top of that, the supply chain had long lead times, making it difficult to respond effectively and quickly to a sudden spike in demand.
Participants only knew demand in the week it occurred, and the true demand was only known to the retailer who had no way of sharing information with the other teams.
Below figure-2.1 shows the demand from the customer side over a period of 20 weeks ie 20 rounds. This information was known only to the retailer.

Figure 2.1: Customer demand over 20 weeks
If we look at figure 2.2 below, we notice the order size fluctuation throughout the 20 rounds.
We see the manufacturer preparing early for the crisis, but the distributor and wholesaler do not start pulling any product in anticipation (participants did know a crisis was coming but they did not, however, know exactly when and how severe).
The retailer responded to the crisis as it occurs. As they knew what the actual demand was, they could respond quickly in terms of ordering. They only needed to react as it was happening.
 Figure 2.2: Order fluctuation by role throughout the first game
If we look at the figure-2.3 below, which reflects the inventory fluctuation throughout the game for each of the roles, we see that the anticipation of the manufacturer backfired.
As they did not have any information on true demand, they kept producing for too long and kept building up inventory up until week 9, long after the spike in demand was over.
 Figure 2.3: Inventory fluctuation by role throughout the first game
In this game, we learned a few things. We found that in general, manufacturers were willing to run the risk and end up with high inventory levels at the end of the crisis.
Wholesale, meanwhile, had a very large risk of backorders. Retailers ran the lowest risk of incurring heavy costs.
The end result was that the wholesaler had built up a significant number of backorders which left them with very high costs.
In real life, this is exactly what happened after the pandemic (when the bullwhip effect hit supply chain), because many retailers have a major power advantage over their wholesalers (and distributors).
They are close to demand, very large, and keep very minimum inventory compared to the rest of the supply chain.
In conclusion, this is what happened overall:

As a community, this gives us something to think about, as we’ll likely see many wholesalers and distributors incurring large costs, and we’ll see many manufacturers produce until long after this crisis will be over.
This could lead to large periods of no production at all and could cause severe effects on employment and stability at the manufacturing level.
One real-life example of this bullwhip in action is PC manufacturer Dell.
In 1994, the company was struggling — massive amounts of PC parts that were ordered in advance were causing profitability headaches.
If purchase forecasts were wrong, the company was stuck with parts it couldn’t sell, and given the speed of hardware evolution, this meant these parts quickly became obsolete.
By 1998, however, Dell had turned its fortunes around. Revenues grew from $2 billion to $16 billion and the company’s return on invested capital with 217 percent.
How did they do it? By creating a tightly-aligned sales model that focused on predictable sales patterns using pre- established customer relationships, along with a “current quarter plus one” strategy that saw Dell limiting inventory and using real-time pricing to reflect evolving component costs and inventory levels.
Testing Tactics to minimize the impact of the Bullwhip Effect:
For the second game, with the same amount of demand (Figure 1), we made changes to the setup of the supply chain and tested a few tactics.
We also modelled the crisis slightly differently so participants had no idea what would happen or when the crisis would come.
The goal of the simulation game was to achieve the lowest total cost across the supply chain with backorders incurring costs and, on the other hand, having inventory incurring costs.
To achieve this aim, we let participants
- Openly collaborate and communicate
- We halved the lead times
This is achievable using Inventory Optimization tools, especially the lead time between the
links in the supply chain which allows them to respond faster.
The final result? Amazing.
This greatly improved the total cost incurred by the supply chains, and even with the demand that was on average 25% higher than in the previous game, the total costs were cut by as much as 75%.
Here’s how.
 Figure 3.1: Order fluctuation by role throughout the second game
In figure 3.1, we observed the order fluctuation in the second game.
We noticed the manufacturer, again, anticipated a crisis. This time, however, the production stabilised just after the crisis began.
Why? Because of information across the whole supply chain.
While manufacturers still ran the highest risk of being left with a large chunk of the inventory at the end of the crisis, their risk was significantly lower as you can observe in the inventory progression in figure 3.2 below.
 Figure 3.2: Inventory fluctuation by role throughout the second game
At the peak of its inventory the manufacturer only had roughly two weeks of products in stock.
This is significantly less than the 10 weeks peak of the inventory we witnessed in the first game.
So, this is what happened at the end of the second game:
What to do to Minimise Bullwhip Effect’s Impact?
Supply chain management is not easy since it involves many parties and uncertainties. However, we’ve shown that by collaborating, sharing information, and or focusing on getting shorter lead times, companies can reduce total supply chain costs.
Not only does it allow supply chains as a whole to react faster to a crisis. It also lowers the cost for all parties involved.
Recognising Demand Drop:
Now post-covid, we’re seeing not only a stabilisation of demand, we see a drop compared to pre-covid.
Let’s first talk about recognising the demand drop, the primary reason for the biggest problems a manufacturer/distributor has to face.
If a demand drop is identified early, the bullwhip effect can be minimised.
In combination with the communication tactics listed above, this offers substantial protection for your business.
Many inventory optimisation and demand & supply planning tools (such as our Slim4) are designed to recognise and adjust demand according to the latest market information, and then notify the user of drops in demand and signal overstock. There are a few characteristics, however, that may make recognising such demand drops a bit tougher than usual:
- If demand drops are relatively low they may not be considered outliers
- If the drop is more immediate, it may not be considered a negative trend.
For example, from Figure 1 (at the beginning of the blog) you see the demand drop which is around the 10-20% mark for many markets.
There is no true outlier, no actual trend.
The demand drop looks more like stepping down the curb from the sidewalk and onto the road.
At an item level, the impact might not be huge but when this happens to thousands of items at the same time, the bottom-line impact is extensive.
As a result, it’s important to recognise demand drop ASAP and act on it as early as possible.
How to act on any future demand drops?
You’ve noticed the demand drop, so what are the best options you have to deal with it? We know we can’t use sales history in the last year to forecast, and algorithms can take time to catch up.
Time is not a luxury we have with interest rates on the rise.
Here are some demand and supply planning steps you can take to help mitigate the impact.
Dealing with Demand Drops:
During sudden market drops demand planning teams need to act proactively even with minimal sales data.
Using available tools (such as ERP or Excel) they can a) recognise which items are affected and b) drive the forecast down by a certain percentage at both the SKU level and at the bulk level.
One way to recognise which SKUs are affected by a demand drop is forecast bias.
To refresh your memory, forecast bias is a measurement of over or under-forecasting.
In case of no under or over-forecast the bias will balance around 0.
Once you sell less than your forecast for a few months in a row, the number will be negative.
Meaning your forecast has been too high and has not been driven down fast enough.
For example, from Figure 1 (at the beginning of the blog) following are the estimated demand and actual demand:
| Time Period | Estimated Demand | Actual Demand | Forecast Error |
|---|---|---|---|
| Month 1 | 84,000 | 82,000 | 2,000 |
| Month 2 | 84,000 | 81,000 | 3,000 |
| Month 3 | 84,000 | 82,000 | 2,000 |
From the above table even though the final demand is the same, the forecast error is around 2-3k every month.
The forecast bias can be calculated as the average of the forecast error.
So in this case that will be
(2000 + 3000 + 2000) / 3 = 2,333
The key for bias is that all errors are positive in this example.
If we would have an error of 3,000, -1,000 and -2,000 we would have a forecast bias of:
(3000 – 1000 – 2000) / 3 = 0
The direction of the errors is the same. Hence, forecast bias is a great measurement to identify items that have structural issues.
It is also important to prioritize which items you look at first.
Due to time constraints, you want to prioritize which items you look at first.
With the post-COVID demand drop, we must make sure to review the right items first.
Here you can combine the items with a high forecast bias with a other parameters to come up with a more urgent list:
1. Coefficient of Variance
The coefficient of variance is a metric that takes the standard deviation and divides it by the average monthly demand.
The higher the number, the more volatile your sales.
The Post- COVID demand drop can lead to an issue with this calculation as volatility can be overestimated.
Due to having a period with higher average sales, and a period with lower average sales, the standard deviation will be too high, in turn leading to higher buffer stocks.
Highly volatile items are typically items where the ratio of standard deviation to average demand is about > 0.75. Play around with this number to find the best ratio for you.
2. Price
Higher-priced items are obviously more important to review first, but it’s better to use a field that contains the forecast value instead.
The higher the number, the better your bottom-line impact when reviewing forecasts.
3. ABC
The ABC code can be a simpler way to review items. In combination with the forecast bias, you can easily isolate your A-items first.
Class-A items are those with a high dollar value that makeup 10%-20% of your inventory but 70%-80% of your annual consumption value.
As a result, they require tight controls and high records of accuracy.
4. Other steps to take
At an item level, it might be difficult to identify segments of your business that are affected more than others. Therefore, it’s critical to review the performance of sales across product groups/markets instead of simply at the SKU level.
Worth Noting: Slimstock’s S&OP module can help you quickly identify product lines or markets more affected than others.
It allows performance reviews for management teams at the aggregate category levels.
Supply Planning:
To review your supply plan, you first need an updated demand plan.
As a result, it’s important that demand planning makes the first move.
After forecasts are updated, you can identify important items with excess stock.
Reports can be created to find items with excess inventory, and evaluate where to rebalance this inventory to.
You can choose your POs to push out, and either push these orders out or cancel them with your vendors.
Another method to prevent new purchases going forward is to rebalance your current excess inventory.
This means taking stock of what you currently have and how it compares to your latest demand plan, then making decisions about where this inventory makes the most sense across multiple business locations.
Bullwhip effect takeaways
Situation Overview:
- Companies are grappling with the pronounced bullwhip effect.
- The pandemic’s impact and fluctuating demand for consumer goods have intensified this effect.
- Shipping container and harbor shortages exacerbated the issue, causing firms to over-order.
- A sudden influx of products has resulted in excessive inventory due to normalized lead times and reduced demand.
Bullwhip Effect and the Supply Chain:
- Figure 1 illustrated the post-COVID demand pattern with a stark drop after May ’22.
- Slimstock conducted two simulation games in 2020 to understand and mitigate the bullwhip effect using a mock supply chain of hand sanitizers.
- Traditional supply chain practices, lacking communication and burdened by long lead times, were applied in the first game.
- In the first simulation, manufacturers produced excessively, while wholesalers incurred high costs from backorders. Retailers, being closest to demand, managed better.
Real-life Illustration:
- Dell Computers faced a similar challenge in 1994 but overcame it by 1998 using a sales model focusing on predictable patterns and real-time pricing.
Tactics to Minimize the Bullwhip Effect:
- The second game incorporated open collaboration, communication, and reduced lead times, resulting in a 75% reduction in supply chain costs.
- Efficient communication across the supply chain aided in better production and inventory management.
Strategies to Combat the Bullwhip Effect:
- Collaboration, sharing information, and shortening lead times are pivotal.
- Recognizing a demand drop early on can help in minimizing the bullwhip effect.
- Inventory optimization and demand & supply planning tools like Slim4 can be instrumental in detecting and adjusting to market shifts.
- Some challenges in recognizing demand drops include modest drops not being considered outliers and immediate drops not being seen as negative trends.
Handling Future Demand Drops:
- Immediate actions are essential during sudden market drops.
- Tools like ERP or Excel can help identify affected items and adjust forecasts.
- Forecast bias, which measures over or under-forecasting, can be a vital metric. For instance, consistent negative values indicate consistent over-forecasting.
- Prioritization criteria include the Coefficient of Variance, Price, ABC coding, and performance reviews at aggregate category levels.
Supply Planning:
- An updated demand plan is paramount for revising the supply plan.
- After updating forecasts, items with surplus stock can be identified, and necessary reports can be generated for better decision-making.
In essence, to mitigate the challenges posed by the bullwhip effect, especially in a post-pandemic world, businesses need to foster improved communication, utilize efficient tools for demand and supply planning, and adopt a proactive approach to forecasting and inventory management.
Bullwhip Effect FAQs
What is bullwhip effect?
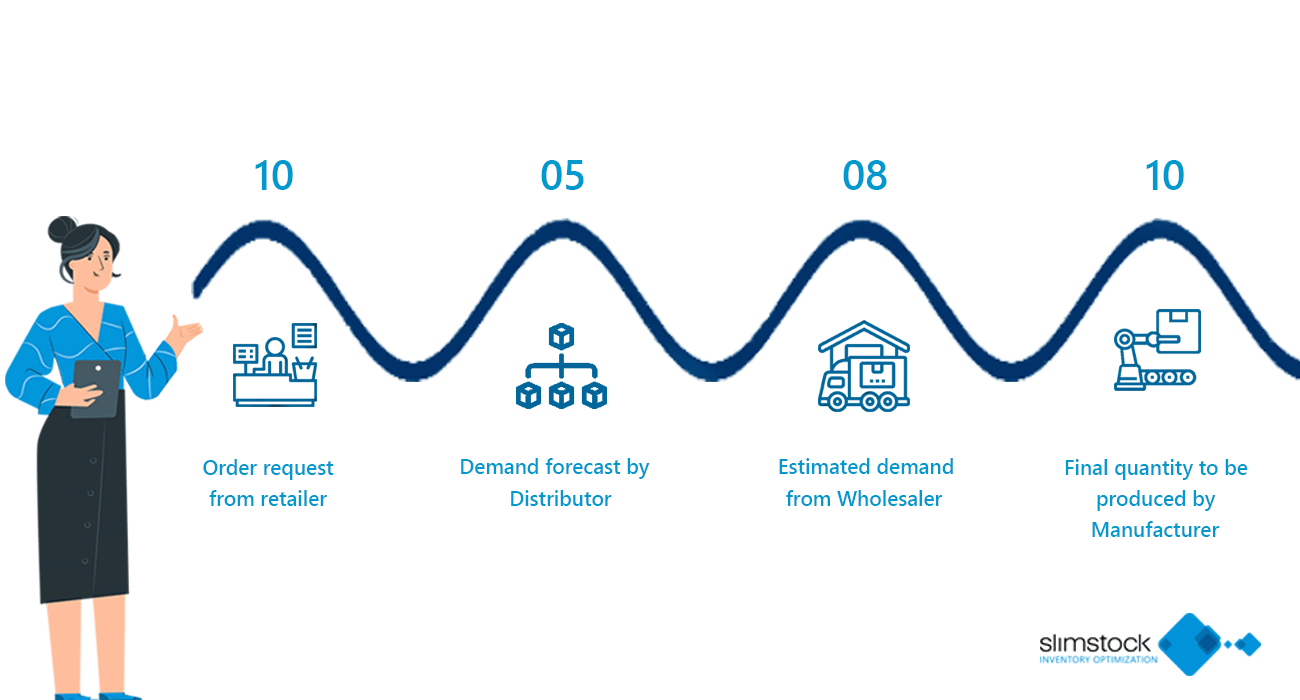
The bullwhip effect occurs when customer demand shifts at the retail level, leading retailers to overreact and wrongly amplify their forecasting impacting the whole supply chain.
What is an example of the bullwhip effect?
If a retailer normaly sells 10 water bottles per day, it would order that replacement amount from the distributor. But one day, the retailer sells 50 bottles and assumes customers will start buying more product, therefore it orders 100 bottles to meet this higher forecasted demand, causing strain across the supply chain.
What is the primary cause of the bullwhip effect?
This mostly occurs when retailers become highly reactive to consumer demand, and in turn, intensify expectations around it.
How does the Bullwhip Effect impact inventory levels?
Due to the amplified order variances at each level of the supply chain, businesses often end up holding more inventory than necessary as a buffer against perceived demand variability.
Does the Bullwhip Effect only affect large and complex supply chains?
No. While the bullwhip effect is often discussed in the context of large supply chains, even smaller chains can experience the effect if there is a lack of communication and synchronization between the entities.
Can technology and software help in mitigating the Bullwhip Effect?
Absolutely. Advanced forecasting tools, real-time data sharing platforms, and integrated planning systems can provide more accurate demand insights and facilitate better coordination among supply chain partners, thus reducing the bullwhip effect.